Random selection of numbers
Page last updated 14 Feb 2023
Before we go any further, let us make it clear that although one might see the term “random number”, there’s no such thing as a “random number”. The term “random” means selected randomly, and a number has no innate randomness; the term random only becomes applicable to a number after it has been chosen by some truly non-predetermined method from a set of numbers, where each number is equally likely - in which case it would be more correct to say “randomly chosen number”. Having got that out of the way, we can observe that one often sees statements such as:
“For any given real number r, the probability of that real number being selected at random is exactly zero.”
This might appear to be rather a strange statement, so let’s look at what it involves. First of all we need to consider what the definition of probability is.
Objectively, the probability of an event having a particular outcome is simply the ratio of the number of times that outcome occurs relative to the total number of events, that is, the number of positive outcomes divided by the total number of events. There are also definitions of probability which include estimates, but here we are only concerned with probability in a rigorously objective sense since we are ostensibly dealing with rigorously calculated values.
For real world events that have occurred, the probability value is in principle completely determined, although in reality some of the data is usually inaccessible. For real world events, one might assume that, given sufficient data, the calculated value is a reasonable prediction of the likelihood of a positive outcome in a future event. A probability value of 1 means that the outcome is certain to occur on every happening of the event, while a probability value of 0 means that the outcome can never occur on any happening of the event.
There are two ways to obtain a probability value:
- By experimentation
- By calculation
In the first case, one can never be certain that the value is ever anything other than an approximation, that is, there is no guarantee that the value given by a particular sample used for the experiment will hold for future events.
In the second case, if one analyses the situation, one may be able to determine the relative frequencies of different outcomes of an event. For example, one may assume that for a perfect die, and given sufficient perturbation of the initial state of the die, the outcomes of any particular number between 1 and 6 occurring are equal and hence the probability of a random throw of the die being, for example, 4 is 1/6.
We now ask what does it mean to “select a real number at random” ?
For a human, one can only select a number that one can define within a reasonable timescale. Obviously, one cannot select a number by actually selecting a limitlessly long string of digits - no, one either has to write down a finite string of digits, or else write down a definition of a number. For an irrational number, the latter is the only possible way of selecting an irrational number. And, as already noted, you are more likely to select a number that can be relatively easily defined - it is not likely that you will select a number that requires twenty million symbols to define it.
So where does the claim come from that, for example, the probability of “selecting at random” the number 0.5 from the set of all real numbers is exactly zero?
Clearly it cannot mean the probability of a human selecting the number 0.5, so the only alternative is that some sort of hypothetical non-physical selection mechanism is being assumed. However, such an assumption cannot sit alongside the claim that the probability of selecting any specific real number is zero. That is contradictory, since on the one hand, any such hypothetical selection mechanism must be something that can select a real number, yet on the other hand, the probability of it selecting any particular number is said to be zero, hence it is impossible for the selection mechanism to actually select any number.
So where does this notion of a probability of exactly zero for selecting the number 0.5 come from? It appears to come from the notion, that, for the event of “selecting a number at random” the ratio of the number of times when that outcome is the number 0.5 to the total number of outcomes. Here we will use
and the assumption is that this has a value of zero.
If the
But why should one assume that
So a simple analysis shows that, unless one considers that the concept of the probability of “selecting a real number at random” means in some way the selection of a real number by a human, the idea that one can assign a meaningful probability value to it has no validity whatsoever.
Questionable assumptions
The pitfalls of making unwarranted implicit assumptions regarding the notion of “choosing real numbers at random” can be demonstrated by a consideration of an old chestnut, the Bertrand Paradox; the analysis can be seen on this site at the Bertrand Paradox.
For a simpler example the pitfalls are nicely shown by the following example (original page at If a real number
“If a real number
The answer is given as:

We are given that
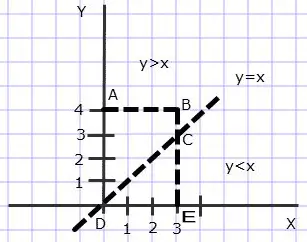
Thus the region
Now, realize that
Thus, the area of the trapezoid = 0.5*(4+1)*3 = 15/2
Finally, the required probability = trapezoid area / total area = (15/2)/12 = 12/24 = 5/8.
So what does it mean here when it says “chosen at random”?
Can it mean that it is the result for numbers chosen by some perfectly unbiased hypothetical selection method? Does it assume that there are “more” points in one case than the other because the corresponding area in one case (the area ABCD, where
So what might the question mean, to choose two real numbers at random? Does it mean that if a human is asked to choose two such numbers at random, the probability is 5/8 that he will pick two numbers where
But is that a plausible response? Alternatively one could reasonably assert that a human choice (assuming that it has some sort of meaning) is equivalent to picking either 0, 1, or 2 for the integer part of the
So what is the ‘real’ meaning of “choosing a real number at random”? Does it have any meaning at all?
On the other hand, one could consider a real world situation and ask, given a line drawn on the ground marked with 0, 1, 2, 3, 4 at equal divisions, given a stone A thrown totally randomly onto the line between 0 and 3 and a stone B thrown totally randomly on the line between 0 and 4, what are the chances that the numerical value of the landing point of A will be less than that of the landing point of B?

Some people would say that this represents the most plausible intention for the posed question:
“If a real number
So how might we calculate this? One way is to create divisions of the line, and then make the divisions smaller and smaller, calculating for each case the probability that the stone A will land in a lower value division than the stone B. We can then see what happens as the divisions become smaller and smaller; as they do so, the number of divisions increases. It is reasonable to consider that the limiting case is a good representation of the notion of the stones landing on individual points.
In the following we use

And so on, so that, for example, for
In general, the total number of possible combinations of the landing divisions of the two stones is given by the formula:
For example, for the above diagram where
In general, the number of these combinations where the stone A lands in a lower value division than the stone B is given by the formula:
Hence the probability that the stone lands in a lower value division than the stone B is given by the formula:
which is the same as:
For the first few values of
for
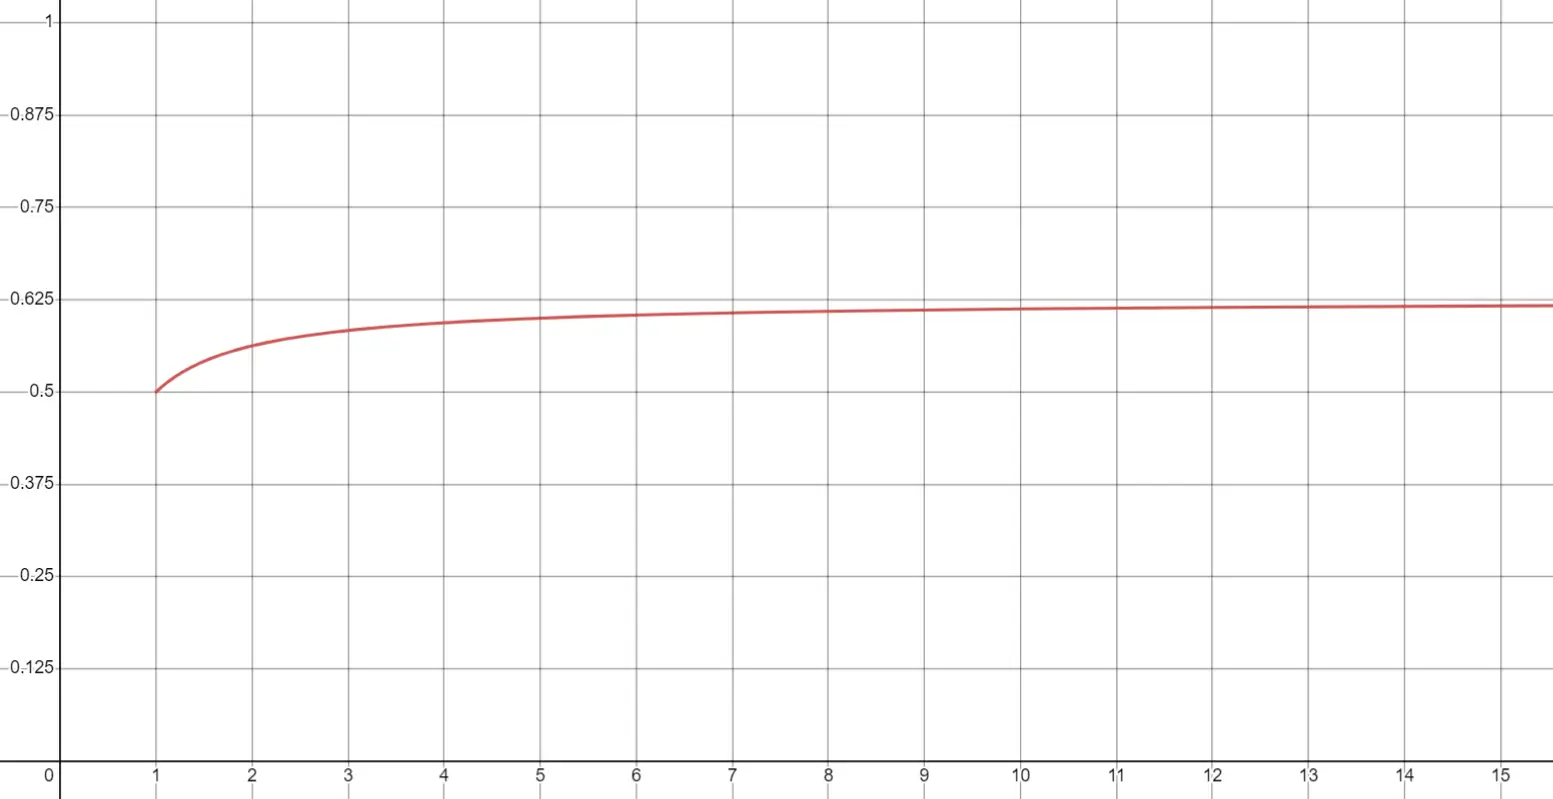
We can plot these values on a graph:

where we see that the curve approaches the value 0.625. Indeed the limiting value of the expression:
as
This is the same answer as that given by the example question. As has just been shown, this answer of 5⁄8 gives an answer that corresponds to the notion of throwing stones randomly onto different areas, or of randomly throwing darts.
 Note that a better layout for a real world physical trial one might want to have a layout something like this, which would give a better approximation to randomness for the physical action of throwing.
But no matter how small the stone is, or how fine the point of the dart is, there is a limit to the precision that can be given to the notion of a landing point - whether the precision is to 5 decimal places or to 100, that limit to the precision means that you have only a finite set of possible values, while there remain infinitely many real numbers not included in that set. Hence a claim that an analysis of the physical situation represents random choices of real numbers would be a claim too far.
While there is a one-to-one correspondence of the points in the interval [0, 3] and the interval [0, 4], one can interpret the answer in terms of a comparison of the relative abundance of regions within the interval, where those regions are small in comparison to the overall interval, and where that relative abundance is 3:4. In the limit case these regions become points, and for the purposes of the calculation of relative probability, the limit case is a case where the limit gives an answer in terms of a limiting ratio of the relative abundance of points.
This should not be surprising - after all, if one is asked what is the probability, if a natural number were to be chosen at random, that it is an even number? The obvious answer is 1⁄2 , and although we know that the natural numbers can be set in a one-to-one correspondence with the even natural numbers, we also know that for any finite upper limit there are half as many even numbers as all numbers, so it can be seen that the limiting value as the finite upper value increases remains as 1⁄2. And in exactly the same way, for the intervals [0, 3] and [0, 4], for any finite number of divisions, the relative abundance of the intervals is always 3:4, and as the number of divisions increase this is also the limiting value.
Models and reality
What is the probability that a person selected at random from the population has a height of exactly 1.9 metres? A mathematical model can be used to calculate probability values for human heights and which uses some form of distribution equation. According to such a model, the probability that a person selected at random has a height of exactly 1.9 metres is zero. Some people seem to think that this is a result of deep significance.
But the actual probability of a person’s height being some value
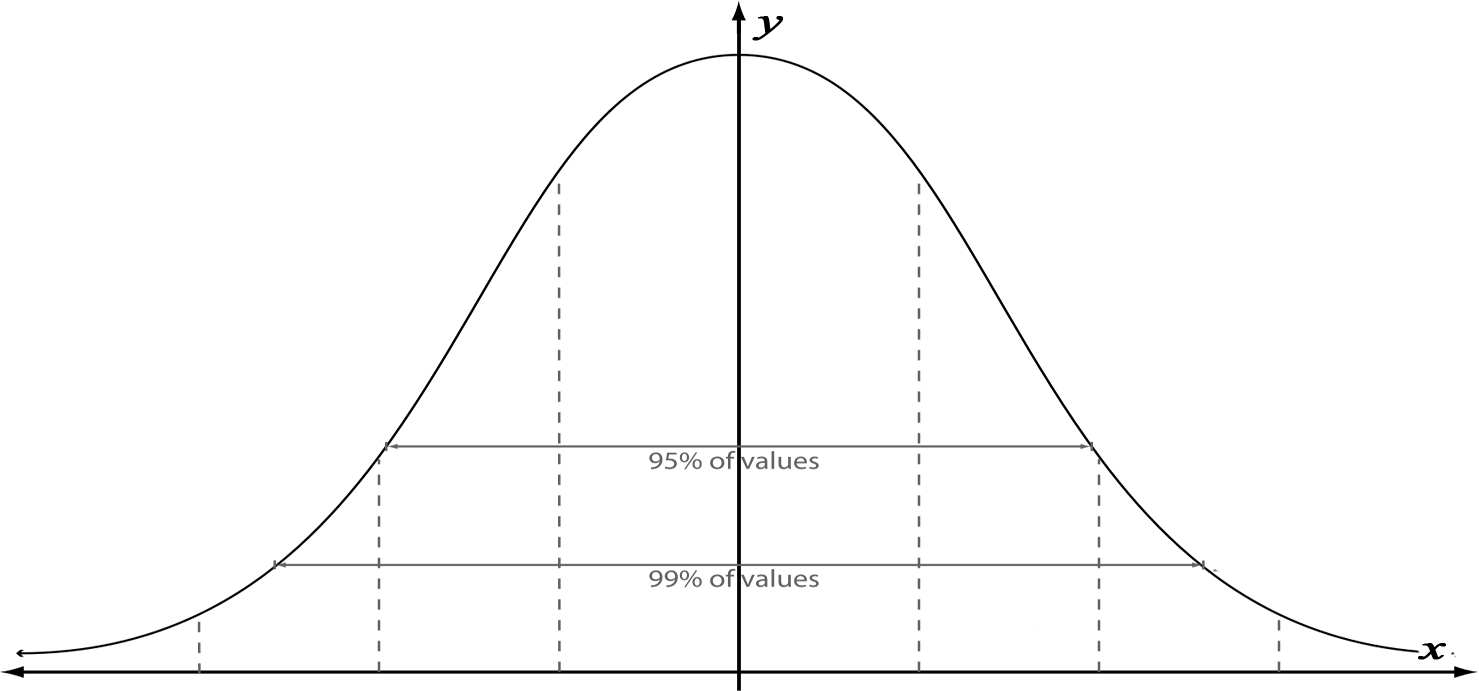
The discrepancy is simply the result of the difference between the mathematical model and the actual real world situation. Such mathematical models are used because they give a very good approximation to certain real world situations, and because they are convenient - but they are not perfect reflections of real world situations. A commonly used distribution equation is the Gaussian normal distribution equation, which is commonly represented in graphical form as a bell curve.

The equation of itself says nothing about probability, but it can be applied as a model that gives a reasonable approximation to certain real world situations. It is simply an equation which defines a curve; for any given situation, it has two fixed parameters and a free variable which is the
However, if you try to obtain the value of the integral (the area below the curve) at a single point, you get the result of zero. It would be a mistake to think that that means that the probability of selecting a person whose height is that particular value is zero. That would be a failure to understand the limitations of applying an idealized mathematical model to a real world situation.
Other Posts


Rationale: Every logical argument must be defined in some language, and every language has limitations. Attempting to construct a logical argument while ignoring how the limitations of language might affect that argument is a bizarre approach. The correct acknowledgment of the interactions of logic and language explains almost all of the paradoxes, and resolves almost all of the contradictions, conundrums, and contentious issues in modern philosophy and mathematics.
Site Mission
Please see the menu for numerous articles of interest. Please leave a comment or send an email if you are interested in the material on this site.
Interested in supporting this site?
You can help by sharing the site with others. You can also donate at where there are full details.